GPT-4o チャットインターフェースと可視化レポートを備えたインタラクティブな Snowflake データブラウザーを作成する
これはInternal Wiki, AI Chatbot分野の自動化ワークフローで、28個のノードを含みます。主にIf, Set, Webhook, Aggregate, Snowflakeなどのノードを使用。 GPT-4o チャットインターフェースと視覚化レポートを備えたインタラクティブな Snowflake データブラウザーを作成
- •HTTP Webhookエンドポイント(n8nが自動生成)
- •OpenAI API Key
使用ノード (28)
{
"meta": {
"instanceId": "6a2a7715680b8313f7cb4676321c5baa46680adfb913072f089f2766f42e43bd",
"templateCredsSetupCompleted": true
},
"nodes": [
{
"id": "695a7e9f-01c6-4290-a085-55099d8db7db",
"name": "チャットメッセージ受信時",
"type": "@n8n/n8n-nodes-langchain.chatTrigger",
"position": [
1100,
-280
],
"webhookId": "8cc040be-d37a-4090-b93e-44603371d13a",
"parameters": {
"options": {}
},
"typeVersion": 1.1
},
{
"id": "6971de5a-a520-4f74-a5c4-87039b22a15f",
"name": "AIエージェント1",
"type": "@n8n/n8n-nodes-langchain.agent",
"position": [
1340,
-280
],
"parameters": {
"options": {
"systemMessage": "You are Snowflake SQL assistant.\n\nUse tools to retrieve data from Snowflake and answer user.\n\nIMPORTANT Always check database schema and table definition for preparing SQL query."
},
"hasOutputParser": true
},
"typeVersion": 2
},
{
"id": "f14d403f-a3d1-4535-aaca-767f9258166c",
"name": "OpenAI チャットモデル1",
"type": "@n8n/n8n-nodes-langchain.lmChatOpenAi",
"position": [
1140,
-80
],
"parameters": {
"model": {
"__rl": true,
"mode": "list",
"value": "gpt-4o-mini"
},
"options": {}
},
"credentials": {
"openAiApi": {
"id": "SphXAX7rlwRLkiox",
"name": "Test club key"
}
},
"typeVersion": 1.2
},
{
"id": "7f57e580-ac48-4926-8dda-5ae581ca7345",
"name": "シンプルメモリ",
"type": "@n8n/n8n-nodes-langchain.memoryBufferWindow",
"position": [
1260,
-80
],
"parameters": {
"sessionKey": "={{ $('When chat message received').item.json.sessionId }}",
"sessionIdType": "customKey"
},
"typeVersion": 1.3
},
{
"id": "f809bc79-d5ed-466c-82c2-4c298a079f10",
"name": "DBスキーマ1",
"type": "n8n-nodes-base.snowflakeTool",
"position": [
1540,
-80
],
"parameters": {
"query": "SELECT table_schema, table_name\nFROM information_schema.tables\nWHERE table_schema = 'TPCH_SF1';",
"operation": "executeQuery",
"descriptionType": "manual",
"toolDescription": "Get list of all tables in database"
},
"credentials": {
"snowflake": {
"id": "YWnLSlN2NAjYvAfU",
"name": "Snowflake account"
}
},
"typeVersion": 1
},
{
"id": "68907f64-aa11-4044-b2ba-d7796fff90f4",
"name": "テーブル定義取得",
"type": "n8n-nodes-base.snowflakeTool",
"position": [
1660,
-80
],
"parameters": {
"query": "SELECT \n column_name,\n data_type\n\nFROM \n SNOWFLAKE_SAMPLE_DATA.information_schema.columns\nWHERE \n table_name = '{{ $fromAI(\"table_name\") }}'\n AND table_schema = 'TPCH_SF1'\nORDER BY \n ordinal_position;\n",
"operation": "executeQuery",
"descriptionType": "manual",
"toolDescription": "Get table definition to find all columns and types."
},
"credentials": {
"snowflake": {
"id": "YWnLSlN2NAjYvAfU",
"name": "Snowflake account"
}
},
"typeVersion": 1
},
{
"id": "226b3c2e-7058-476e-a96c-d6cf8bd4f53b",
"name": "Webhook",
"type": "n8n-nodes-base.webhook",
"position": [
1000,
860
],
"webhookId": "87893585-d157-468d-a9af-7238784e814c",
"parameters": {
"path": "87893585-d157-468d-a9af-7238784e814c",
"options": {},
"responseMode": "responseNode"
},
"typeVersion": 2
},
{
"id": "f7abd0a8-8aa4-4aa7-ae24-22d40736c67f",
"name": "HTML設定",
"type": "n8n-nodes-base.set",
"onError": "continueErrorOutput",
"position": [
1600,
860
],
"parameters": {
"options": {},
"assignments": {
"assignments": [
{
"id": "1257d6ca-3c5c-476b-8d26-f8fb84a0c38e",
"name": "html",
"type": "string",
"value": "=<!DOCTYPE html>\n<html>\n<head>\n <title>Dashboard</title>\n <style>\n body { \n font-family: Arial, sans-serif; \n padding: 20px;\n margin: 0;\n }\n .container { \n max-width: 1200px; \n margin: 0 auto; \n }\n table {\n border-collapse: collapse;\n width: 100%;\n margin: 20px 0;\n }\n th, td {\n border: 1px solid #ddd;\n padding: 8px;\n text-align: left;\n }\n th {\n background-color: #f2f2f2;\n cursor: pointer;\n }\n th:hover {\n background-color: #ddd;\n }\n .controls {\n margin: 20px 0;\n padding: 10px;\n background: #f8f8f8;\n border-radius: 4px;\n }\n .btn {\n padding: 8px 16px;\n margin: 0 5px;\n cursor: pointer;\n background: #4CAF50;\n color: white;\n border: none;\n border-radius: 4px;\n }\n .btn:hover {\n background: #45a049;\n }\n .tab-container {\n margin: 20px 0;\n }\n .tab-button {\n padding: 10px 20px;\n border: none;\n background: #f2f2f2;\n cursor: pointer;\n }\n .tab-button.active {\n background: #4CAF50;\n color: white;\n }\n .graph-controls {\n display: grid;\n grid-template-columns: repeat(auto-fit, minmax(200px, 1fr));\n gap: 15px;\n margin: 20px 0;\n padding: 15px;\n background: #f8f8f8;\n border-radius: 4px;\n }\n .control-group {\n display: flex;\n flex-direction: column;\n gap: 5px;\n }\n select, input {\n padding: 8px;\n border: 1px solid #ddd;\n border-radius: 4px;\n }\n #graphContainer {\n background: white;\n padding: 20px;\n border: 1px solid #ddd;\n border-radius: 4px;\n margin: 20px 0;\n }\n/* Sorting icons styles */\nth {\n position: relative;\n padding-right: 25px; /* Space for sort icon */\n}\nth:after {\n content: '↕';\n position: absolute;\n right: 8px;\n color: #999;\n}\nth.sort-asc:after {\n content: '↑';\n color: #000;\n}\nth.sort-desc:after {\n content: '↓';\n color: #000;\n}\n\n/* Pagination styles */\n.pagination {\n display: flex;\n gap: 10px;\n align-items: center;\n margin: 20px 0;\n justify-content: center;\n}\n.pagination button {\n padding: 5px 10px;\n border: 1px solid #ddd;\n background: white;\n cursor: pointer;\n border-radius: 4px;\n}\n.pagination button:disabled {\n background: #f5f5f5;\n cursor: not-allowed;\n opacity: 0.5;\n}\n.pagination span {\n padding: 0 10px;\n}\n.page-size {\n margin-left: 20px;\n}\n.templates-section {\n grid-column: 1 / -1;\n padding: 10px;\n border-bottom: 1px solid #ddd;\n margin-bottom: 15px;\n}\n\n.template-buttons {\n display: flex;\n gap: 10px;\n flex-wrap: wrap;\n margin-top: 10px;\n}\n\n.template-button {\n padding: 8px 16px;\n background: #f0f0f0;\n border: 1px solid #ddd;\n border-radius: 4px;\n cursor: pointer;\n transition: all 0.3s;\n}\n\n.template-button:hover {\n background: #e0e0e0;\n}\n\n.template-button.active {\n background: #4CAF50;\n color: white;\n border-color: #4CAF50;\n}\n </style>\n <!-- React and ReactDOM dependencies -->\n <script crossorigin src=\"https://cdnjs.cloudflare.com/ajax/libs/react/17.0.2/umd/react.production.min.js\"></script>\n <script crossorigin src=\"https://cdnjs.cloudflare.com/ajax/libs/react-dom/17.0.2/umd/react-dom.production.min.js\"></script>\n \n\n\n<!-- Add this after other script tags -->\n<script src=\"https://cdn.jsdelivr.net/npm/chart.js\"></script>\n\n</head>\n<body>\n <div class=\"container\">\n <h1>Dashboard</h1>\n \n <div class=\"tab-container\">\n <button class=\"tab-button active\" onclick=\"switchTab('table')\">Table View</button>\n <button class=\"tab-button\" onclick=\"switchTab('graph')\">Graph View</button>\n </div>\n\n <!-- Table View -->\n <div id=\"tableView\">\n <div class=\"controls\">\n <input type=\"text\" id=\"filterInput\" placeholder=\"Search...\" />\n <select id=\"filterColumn\">\n <option value=\"all\">All Columns</option>\n </select>\n <button class=\"btn\" onclick=\"exportToCSV()\">Export to CSV</button>\n </div>\n <div id=\"tableContainer\"></div>\n<div class=\"pagination\">\n <button onclick=\"previousPage()\" id=\"prevBtn\">Previous</button>\n <span id=\"pageInfo\">Page 1 of 1</span>\n <button onclick=\"nextPage()\" id=\"nextBtn\">Next</button>\n <select id=\"pageSize\" onchange=\"changePageSize()\" class=\"page-size\">\n <option value=\"5\">5 per page</option>\n <option value=\"10\" selected>10 per page</option>\n <option value=\"20\">20 per page</option>\n <option value=\"50\">50 per page</option>\n </select>\n</div>\n </div>\n\n <!-- Graph View -->\n <div id=\"graphView\" style=\"display: none;\">\n <div class=\"graph-controls\">\n <!-- Add templates section -->\n <div class=\"templates-section\">\n <h3>Chart Templates</h3>\n <div id=\"templateButtons\" class=\"template-buttons\">\n <!-- Template buttons will be added here dynamically -->\n </div>\n </div>\n \n <!-- Existing controls -->\n <div class=\"control-group\">\n <label>X Axis:</label>\n <select id=\"xAxis\" onchange=\"updateGraph()\"></select>\n </div>\n <div class=\"control-group\">\n <label>Y Axis:</label>\n <select id=\"yAxis\" onchange=\"updateGraph()\"></select>\n </div>\n <div class=\"control-group\">\n <label>Group By:</label>\n <select id=\"groupBy\" onchange=\"updateGraph()\"></select>\n </div>\n <div class=\"control-group\">\n <label>Chart Type:</label>\n <select id=\"chartType\" onchange=\"updateGraph()\">\n <option value=\"bar\">Bar Chart</option>\n <option value=\"line\">Line Chart</option>\n <option value=\"pie\">Pie Chart</option>\n <option value=\"doughnut\">Doughnut Chart</option>\n</select>\n </div>\n<!-- Add this in graph-controls div after other controls -->\n<div class=\"control-group\">\n <label>Aggregation:</label>\n <select id=\"aggregation\" onchange=\"updateGraph()\">\n <option value=\"sum\">Sum</option>\n <option value=\"average\">Average</option>\n <option value=\"count\">Count</option>\n <option value=\"min\">Minimum</option>\n <option value=\"max\">Maximum</option>\n </select>\n</div>\n </div>\n <div id=\"graphContainer\">\n <canvas id=\"myChart\"></canvas>\n </div>\n</div>\n\n <script>\n // Sample data - sales transactions\n const data = {{ JSON.stringify($json.data) }};\n // Column type definitions for formatting\n function detectColumnTypes(data) {\n if (!data || data.length === 0) return {};\n \n // Get keys from first data item\n const firstItem = data[0];\n const columnTypes = {};\n \n // Determine type for each column\n Object.keys(firstItem).forEach(key => {\n const value = firstItem[key];\n let type = 'string'; // default type\n \n if (value instanceof Date) {\n type = 'date';\n } else if (typeof value === 'number') {\n type = 'number';\n } else if (typeof value === 'boolean') {\n type = 'boolean';\n } else if (typeof value === 'string') {\n // Check if string is actually a date\n const dateCheck = new Date(value);\n if (!isNaN(dateCheck) && value.includes('-')) {\n type = 'date';\n } else {\n type = 'string';\n }\n }\n \n columnTypes[key] = type;\n });\n \n return columnTypes;\n}\n\n// Remove the hardcoded columnTypes and replace with:\nlet columnTypes = {};\n\n let filteredData = [...data];\n let currentPage = 1;\n let pageSize = 10;\nlet currentSortColumn = null;\nlet sortAscending = true;\n\n\n\nfunction initializeGraphControls() {\n const templateContainer = document.getElementById('templateButtons');\n templateContainer.innerHTML = chartTemplates.map((template, index) => `\n <button class=\"template-button\" onclick=\"applyTemplate(${index})\">\n ${template.title}\n </button>\n `).join('');\n}\n\n function initialize() {\n // Detect column types from data\n columnTypes = detectColumnTypes(data);\n console.log('Detected columns:', columnTypes);\n \n const columns = Object.keys(columnTypes);\n \n // Initialize filter dropdown\n const filterColumn = document.getElementById('filterColumn');\n filterColumn.innerHTML = '<option value=\"all\">All Columns</option>';\n columns.forEach(column => {\n filterColumn.innerHTML += `<option value=\"${column}\">${column}</option>`;\n });\n\n // Initialize graph axis selectors\n const xAxis = document.getElementById('xAxis');\n const yAxis = document.getElementById('yAxis');\n // In the initialize function, add empty option for groupBy\nconst groupBy = document.getElementById('groupBy');\ngroupBy.innerHTML = '<option value=\"\">No Grouping</option>';\ncolumns.forEach(column => {\n groupBy.innerHTML += `<option value=\"${column}\">${column}</option>`;\n});\n \n xAxis.innerHTML = '';\n yAxis.innerHTML = '';\n \n columns.forEach(column => {\n xAxis.innerHTML += `<option value=\"${column}\">${column}</option>`;\n yAxis.innerHTML += `<option value=\"${column}\">${column}</option>`;\n groupBy.innerHTML += `<option value=\"${column}\">${column}</option>`;\n });\n\n // Set default Y axis to a numeric column\n const numericColumns = columns.filter(col => columnTypes[col] === 'number');\n if (numericColumns.length > 0) {\n yAxis.value = numericColumns[0];\n }\n\n setupEventListeners();\n refreshTable();\n initializeGraphControls();\n}\n\n // Format cell values based on type\n function formatValue(value, type) {\n if (value === null || value === undefined) return '';\n \n switch (type) {\n case 'date':\n return new Date(value).toLocaleDateString();\n case 'number':\n return value.toLocaleString();\n case 'boolean':\n return value ? 'Yes' : 'No';\n default:\n return value.toString();\n }\n }\n\n // Create and update table\n function createTable() {\n const table = document.createElement('table');\n const thead = document.createElement('thead');\n const tbody = document.createElement('tbody');\n \n // Create header row with sorting indicators\n const headerRow = document.createElement('tr');\n Object.keys(columnTypes).forEach(column => {\n const th = document.createElement('th');\n th.textContent = column.charAt(0).toUpperCase() + column.slice(1);\n th.onclick = () => sortTable(column);\n \n // Add sorting indicators\n if (column === currentSortColumn) {\n th.classList.add(sortAscending ? 'sort-asc' : 'sort-desc');\n }\n \n headerRow.appendChild(th);\n });\n thead.appendChild(headerRow);\n \n // Apply pagination\n const startIndex = (currentPage - 1) * pageSize;\n const endIndex = Math.min(startIndex + pageSize, filteredData.length);\n const paginatedData = filteredData.slice(startIndex, endIndex);\n \n // Create data rows\n paginatedData.forEach(row => {\n const tr = document.createElement('tr');\n Object.entries(columnTypes).forEach(([column, type]) => {\n const td = document.createElement('td');\n td.textContent = formatValue(row[column], type);\n if (type === 'boolean') {\n td.style.color = row[column] ? 'green' : 'red';\n }\n tr.appendChild(td);\n });\n tbody.appendChild(tr);\n });\n \n table.appendChild(thead);\n table.appendChild(tbody);\n updatePagination();\n return table;\n}\n\n // Sort table by column\n // Replace your existing sortTable function\nfunction sortTable(column) {\n if (currentSortColumn === column) {\n sortAscending = !sortAscending;\n } else {\n currentSortColumn = column;\n sortAscending = true;\n }\n \n const type = columnTypes[column];\n filteredData.sort((a, b) => {\n const valueA = a[column];\n const valueB = b[column];\n \n let comparison = 0;\n switch (type) {\n case 'number':\n comparison = valueA - valueB;\n break;\n case 'date':\n comparison = new Date(valueA) - new Date(valueB);\n break;\n case 'boolean':\n comparison = valueA === valueB ? 0 : valueA ? -1 : 1;\n break;\n default:\n comparison = valueA.toString().localeCompare(valueB.toString());\n }\n return sortAscending ? comparison : -comparison;\n });\n \n refreshTable();\n}\n\n // Filter data\n function filterData() {\n const filterValue = document.getElementById('filterInput').value.toLowerCase();\n const filterColumn = document.getElementById('filterColumn').value;\n \n filteredData = data.filter(row => {\n if (filterColumn === 'all') {\n return Object.values(row).some(value => \n value.toString().toLowerCase().includes(filterValue)\n );\n } else {\n return row[filterColumn].toString().toLowerCase().includes(filterValue);\n }\n });\n \n refreshTable();\n if (document.getElementById('graphView').style.display !== 'none') {\n updateGraph();\n }\n }\n\n // Update graph\n function updateGraph() {\n const xAxis = document.getElementById('xAxis').value;\n const yAxis = document.getElementById('yAxis').value;\n const groupBy = document.getElementById('groupBy').value;\n const chartType = document.getElementById('chartType').value;\n const aggregation = document.getElementById('aggregation').value;\n \n // Prepare data\n const groupedData = {};\n filteredData.forEach(row => {\n const groupKey = groupBy ? row[groupBy] : 'All';\n if (!groupedData[groupKey]) {\n groupedData[groupKey] = {};\n }\n const xValue = formatValue(row[xAxis], columnTypes[xAxis]);\n if (!groupedData[groupKey][xValue]) {\n groupedData[groupKey][xValue] = [];\n }\n groupedData[groupKey][xValue].push(parseFloat(row[yAxis]) || 0);\n });\n\n // Process data with aggregation\n const labels = [...new Set(filteredData.map(item => formatValue(item[xAxis], columnTypes[xAxis])))];\n const datasets = Object.entries(groupedData).map(([key, values]) => ({\n label: key,\n data: labels.map(label => {\n const vals = values[label] || [];\n switch(aggregation) {\n case 'sum':\n return vals.reduce((a, b) => a + b, 0);\n case 'average':\n return vals.length ? vals.reduce((a, b) => a + b, 0) / vals.length : 0;\n case 'count':\n return vals.length;\n case 'min':\n return vals.length ? Math.min(...vals) : 0;\n case 'max':\n return vals.length ? Math.max(...vals) : 0;\n default:\n return vals.reduce((a, b) => a + b, 0);\n }\n })\n }));\n // Create chart\n const ctx = document.getElementById('myChart');\n if (window.currentChart) {\n window.currentChart.destroy();\n }\n \n // Update the chart configuration in updateGraph function\nwindow.currentChart = new Chart(ctx, {\n type: chartType,\n data: {\n labels: labels,\n datasets: datasets.map(dataset => ({\n ...dataset,\n // Line chart settings\n borderWidth: 2,\n tension: 0, // Remove curve for straight lines\n pointRadius: 4, // Larger points\n pointHoverRadius: 6,\n \n // Bar chart settings\n barPercentage: 0.8, // Make bars wider (0-1)\n categoryPercentage: 0.9, // Space between bar groups\n \n // Colors\n backgroundColor: dataset.backgroundColor || 'rgba(75, 192, 192, 0.6)',\n borderColor: dataset.borderColor || 'rgba(75, 192, 192, 1)',\n }))\n },\n options: {\n responsive: true,\n plugins: {\n legend: {\n position: 'top',\n }\n },\n scales: chartType !== 'pie' && chartType !== 'doughnut' ? {\n y: {\n beginAtZero: true,\n ticks: {\n font: {\n size: 12\n }\n }\n },\n x: {\n ticks: {\n font: {\n size: 12\n }\n }\n }\n } : undefined,\n // Pie chart size control\n layout: {\n padding: 20\n },\n aspectRatio: chartType === 'pie' || chartType === 'doughnut' ? 2 : 1.5,\n }\n});}\n\n // Export to CSV\n function exportToCSV() {\n const headers = Object.keys(columnTypes);\n const csv = [\n headers.join(','),\n ...filteredData.map(row =>\n headers.map(header => {\n const value = formatValue(row[header], columnTypes[header]);\n return `\"${value.toString().replace(/\"/g, '\"\"')}\"`\n }).join(',')\n )\n ].join('\\n');\n \n const blob = new Blob([csv], { type: 'text/csv' });\n const url = window.URL.createObjectURL(blob);\n const a = document.createElement('a');\n a.href = url;\n a.download = 'export.csv';\n a.click();\n }\n\n // Switch between table and graph views\n function switchTab(tab) {\n document.querySelectorAll('.tab-button').forEach(button => {\n button.classList.remove('active');\n });\n document.querySelector(`[onclick=\"switchTab('${tab}')\"]`).classList.add('active');\n \n document.getElementById('tableView').style.display = tab === 'table' ? 'block' : 'none';\n document.getElementById('graphView').style.display = tab === 'graph' ? 'block' : 'none';\n \n if (tab === 'graph') {\n updateGraph();\n }\n }\n\n // Set up event listeners\n\n // Set up event listeners\nfunction setupEventListeners() {\n // Filter input listener\n document.getElementById('filterInput').addEventListener('input', filterData);\n document.getElementById('filterColumn').addEventListener('change', filterData);\n \n // Graph control listeners\n document.getElementById('xAxis').addEventListener('change', updateGraph);\n document.getElementById('yAxis').addEventListener('change', updateGraph);\n document.getElementById('groupBy').addEventListener('change', updateGraph);\n document.getElementById('chartType').addEventListener('change', updateGraph);\n document.getElementById('aggregation').addEventListener('change', updateGraph); // Add this line\n}\n\n // Refresh table display\n function refreshTable() {\n const container = document.getElementById('tableContainer');\n container.innerHTML = '';\n container.appendChild(createTable());\n }\n// Add these pagination functions before initialize()\nfunction updatePagination() {\n const totalPages = Math.ceil(filteredData.length / pageSize);\n document.getElementById('pageInfo').textContent = `Page ${currentPage} of ${totalPages}`;\n document.getElementById('prevBtn').disabled = currentPage === 1;\n document.getElementById('nextBtn').disabled = currentPage === totalPages || totalPages === 0;\n}\n\nfunction previousPage() {\n if (currentPage > 1) {\n currentPage--;\n refreshTable();\n }\n}\n\nfunction nextPage() {\n const totalPages = Math.ceil(filteredData.length / pageSize);\n if (currentPage < totalPages) {\n currentPage++;\n refreshTable();\n }\n}\n\nfunction changePageSize() {\n pageSize = parseInt(document.getElementById('pageSize').value);\n currentPage = 1;\n refreshTable();\n}\n // Start the application\n initialize();\n </script>\n</body>\n</html>"
}
]
}
},
"typeVersion": 3.4
},
{
"id": "e08d0061-a5b9-452d-aae1-dd06c5e76478",
"name": "Webhookへ応答",
"type": "n8n-nodes-base.respondToWebhook",
"position": [
2020,
860
],
"parameters": {
"options": {},
"respondWith": "text",
"responseBody": "={{ $json.html }}"
},
"typeVersion": 1.1
},
{
"id": "caec4943-2a9e-4c93-b9f0-46c05e1c977b",
"name": "Snowflake1",
"type": "n8n-nodes-base.snowflake",
"onError": "continueErrorOutput",
"position": [
1200,
860
],
"parameters": {
"query": "{{ $json.query.sql }}",
"operation": "executeQuery"
},
"credentials": {
"snowflake": {
"id": "YWnLSlN2NAjYvAfU",
"name": "Snowflake account"
}
},
"retryOnFail": false,
"typeVersion": 1
},
{
"id": "7bf75ddf-38df-454d-908f-32cbeb785464",
"name": "集計1",
"type": "n8n-nodes-base.aggregate",
"position": [
1420,
860
],
"parameters": {
"options": {},
"aggregate": "aggregateAllItemData"
},
"typeVersion": 1
},
{
"id": "eb82d533-e0a0-4328-a31c-39433cf45740",
"name": "他ワークフロー実行時",
"type": "n8n-nodes-base.executeWorkflowTrigger",
"position": [
1000,
320
],
"parameters": {
"workflowInputs": {
"values": [
{
"name": "query"
}
]
}
},
"typeVersion": 1.1
},
{
"id": "3b69b3eb-7a91-43b3-8839-13b5bbdf3203",
"name": "データ取得",
"type": "@n8n/n8n-nodes-langchain.toolWorkflow",
"position": [
1400,
-80
],
"parameters": {
"workflowId": {
"__rl": true,
"mode": "list",
"value": "kqpZSjy0tzRRY4hH",
"cachedResultName": "My workflow 41"
},
"description": "Generate custom SQL queries using knowledge about DB schema and table definitions to provide needed response for user request.\nUse ->> operator to extract JSON data.\n\nSupported functions for big data analysis:\n• GROUP BY – for grouping data\n• SUM() – for summing values\n• AVG() – for calculating averages\n• COUNT() – for counting records\n• MIN() – for finding the minimum value\n• MAX() – for finding the maximum value\n• MEDIAN() – for median calculation\n• STDDEV() – for standard deviation\n• VARIANCE() – for variance calculation\n• PERCENTILE_CONT() – for percentile calculations\n• MODE() – for most frequent value\n• TREND() – for trend analysis over time\n• WINDOW FUNCTIONS – for advanced analytics (e.g., ROW_NUMBER(), RANK(), PARTITION BY)\n\nQuery example:\nSELECT * FROM FILES",
"workflowInputs": {
"value": {
"query": "={{ $fromAI(\"sql_query\",\"SQL query\") }}"
},
"schema": [
{
"id": "query",
"type": "string",
"display": true,
"removed": false,
"required": false,
"displayName": "query",
"defaultMatch": false,
"canBeUsedToMatch": true
}
],
"mappingMode": "defineBelow",
"matchingColumns": [
"query"
],
"attemptToConvertTypes": false,
"convertFieldsToString": false
}
},
"typeVersion": 2.2
},
{
"id": "8968d722-6b26-42d9-b750-0b13c382f7ab",
"name": "付箋",
"type": "n8n-nodes-base.stickyNote",
"position": [
940,
120
],
"parameters": {
"width": 1140,
"height": 560,
"content": "### Tool\n"
},
"typeVersion": 1
},
{
"id": "33544700-b10f-441a-852c-0f985158cb5c",
"name": "付箋1",
"type": "n8n-nodes-base.stickyNote",
"position": [
940,
720
],
"parameters": {
"width": 1360,
"height": 480,
"content": "### Report workflow"
},
"typeVersion": 1
},
{
"id": "d279cb96-4fc5-4554-9363-669aea575926",
"name": "付箋2",
"type": "n8n-nodes-base.stickyNote",
"position": [
940,
-360
],
"parameters": {
"width": 900,
"height": 440,
"content": "### Agent"
},
"typeVersion": 1
},
{
"id": "fc341443-ec9c-4005-8b67-dce59e8b4119",
"name": "SQL実行",
"type": "n8n-nodes-base.snowflake",
"onError": "continueErrorOutput",
"position": [
1200,
320
],
"parameters": {
"query": "{{ $json.query }}",
"operation": "executeQuery"
},
"credentials": {
"snowflake": {
"id": "YWnLSlN2NAjYvAfU",
"name": "Snowflake account"
}
},
"retryOnFail": false,
"typeVersion": 1
},
{
"id": "935f1932-e803-4daf-89ae-e3ce9f322962",
"name": "データ集計",
"type": "n8n-nodes-base.aggregate",
"position": [
1420,
260
],
"parameters": {
"options": {},
"aggregate": "aggregateAllItemData"
},
"typeVersion": 1
},
{
"id": "1c7362be-e338-4976-8a18-a40f11e01ef1",
"name": "カウント>100の場合",
"type": "n8n-nodes-base.if",
"position": [
1600,
280
],
"parameters": {
"options": {},
"conditions": {
"options": {
"version": 2,
"leftValue": "",
"caseSensitive": true,
"typeValidation": "strict"
},
"combinator": "and",
"conditions": [
{
"id": "5a485a5a-28fb-4914-8fb6-131a159db08d",
"operator": {
"type": "array",
"operation": "lengthGt",
"rightType": "number"
},
"leftValue": "={{ $json.data }}",
"rightValue": 100
}
]
}
},
"typeVersion": 2.2
},
{
"id": "36440a5e-d254-4995-be8e-2e8313b8bc29",
"name": "レポートへリンク",
"type": "n8n-nodes-base.set",
"position": [
1800,
200
],
"parameters": {
"mode": "raw",
"options": {},
"jsonOutput": "={\"output\":\"[Link to report](https://n8n.lowcoding.dev/webhook/87893585-d157-468d-a9af-7238784e814c?sql={{ $('When Executed by Another Workflow').item.json.query.urlEncode() }})\"}"
},
"typeVersion": 3.4
},
{
"id": "c581ea63-c210-4df9-b029-f58c1c8da75d",
"name": "データ返却",
"type": "n8n-nodes-base.set",
"position": [
1800,
360
],
"parameters": {
"mode": "raw",
"options": {},
"jsonOutput": "={{ $json }}"
},
"typeVersion": 3.4
},
{
"id": "4fa89cd3-64d8-40cf-87f1-d604aca9c7eb",
"name": "エラー返却",
"type": "n8n-nodes-base.set",
"position": [
1600,
460
],
"parameters": {
"mode": "raw",
"options": {},
"jsonOutput": "={{ $json }}"
},
"typeVersion": 3.4
},
{
"id": "c67e5a20-e116-4955-bc66-fe8b4384b284",
"name": "エラーページ",
"type": "n8n-nodes-base.set",
"position": [
1800,
1000
],
"parameters": {
"options": {},
"assignments": {
"assignments": [
{
"id": "1257d6ca-3c5c-476b-8d26-f8fb84a0c38e",
"name": "html",
"type": "string",
"value": "=<!DOCTYPE html>\n<html>\n<head>\n <title>Error Status</title>\n <style>\n body { \n font-family: Arial, sans-serif; \n padding: 20px;\n margin: 0;\n display: flex;\n min-height: 100vh;\n align-items: center;\n justify-content: center;\n background-color: #f8f9fa;\n }\n .container { \n max-width: 600px;\n margin: 0 auto;\n text-align: center;\n padding: 40px;\n background: white;\n border-radius: 8px;\n box-shadow: 0 2px 4px rgba(0,0,0,0.1);\n }\n .error-icon {\n font-size: 48px;\n margin-bottom: 20px;\n color: #dc3545;\n }\n .title {\n color: #dc3545;\n margin-bottom: 16px;\n font-size: 24px;\n }\n .message {\n color: #666;\n margin-bottom: 24px;\n font-size: 16px;\n line-height: 1.5;\n }\n .btn {\n padding: 10px 20px;\n background: #dc3545;\n color: white;\n border: none;\n border-radius: 4px;\n cursor: pointer;\n font-size: 16px;\n text-decoration: none;\n display: inline-block;\n margin: 0 8px;\n }\n .btn:hover {\n background: #c82333;\n }\n .btn-secondary {\n background: #6c757d;\n }\n .btn-secondary:hover {\n background: #5a6268;\n }\n .details {\n margin-top: 20px;\n padding-top: 20px;\n border-top: 1px solid #eee;\n color: #888;\n font-size: 14px;\n }\n .error-code {\n font-family: monospace;\n background: #f8f9fa;\n padding: 8px 16px;\n border-radius: 4px;\n display: inline-block;\n margin: 8px 0;\n }\n </style>\n</head>\n<body>\n <div class=\"container\">\n <div class=\"error-icon\">⚠️</div>\n <h1 class=\"title\">Error Occurred</h1>\n <p class=\"message\">An error occurred while preparing the analysis data.</p>\n <p class=\"message\">Please try again later or contact support if the problem persists.</p>\n <div class=\"error-code\">Error Code: HTML_PREP_ERROR</div>\n <div>\n <a href=\"javascript:window.close();\" class=\"btn\">Close Window</a>\n <a href=\"javascript:location.reload();\" class=\"btn btn-secondary\">Try Again</a>\n </div>\n <div class=\"details\">\n <p>Analysis ID: <span id=\"analysisId\"></span></p>\n <p>Time: <span id=\"errorTime\"></span></p>\n </div>\n </div>\n\n <script>\n // Get URL parameters\n const urlParams = new URLSearchParams(window.location.search);\n const analysisId = urlParams.get('analysis_id');\n \n // Update details\n document.getElementById('analysisId').textContent = analysisId || 'N/A';\n document.getElementById('errorTime').textContent = new Date().toLocaleString();\n </script>\n</body>\n</html>"
}
]
}
},
"typeVersion": 3.4
},
{
"id": "f614bdcc-e19a-4048-9b13-2adf8b416e56",
"name": "付箋4",
"type": "n8n-nodes-base.stickyNote",
"position": [
1980,
200
],
"parameters": {
"color": 5,
"height": 80,
"content": "### Replace webhook address"
},
"typeVersion": 1
},
{
"id": "6ac29201-e714-4d00-b9ca-e2063267dcb3",
"name": "付箋5",
"type": "n8n-nodes-base.stickyNote",
"position": [
1360,
60
],
"parameters": {
"color": 5,
"width": 160,
"height": 80,
"content": "### Map this workflow"
},
"typeVersion": 1
},
{
"id": "3955749d-31e0-4dc8-9e39-13c1f3de700d",
"name": "付箋6",
"type": "n8n-nodes-base.stickyNote",
"position": [
1540,
60
],
"parameters": {
"color": 5,
"height": 80,
"content": "### Replace name of schema and database"
},
"typeVersion": 1
},
{
"id": "b71fbe78-5527-4857-a259-bfa9fc0a0537",
"name": "付箋11",
"type": "n8n-nodes-base.stickyNote",
"position": [
260,
-360
],
"parameters": {
"color": 7,
"width": 636.2128494576581,
"height": 497.1532689930921,
"content": "\n## AI Agent to chat with Snowflake database with UI\n**Made by [Mark Shcherbakov](https://www.linkedin.com/in/marklowcoding/) from community [5minAI](https://www.skool.com/5minai-pro)**\n\nThis workflow is designed for developers, data analysts, and business professionals who want to interact with their Snowflake data conversationally. It suits users looking to automate SQL query generation with AI, manage large datasets efficiently, and produce interactive reports without deep technical knowledge.\n\n**Preparation** \n- Create your Snowflake credentials in n8n with required host and account details, warehouse (e.g., \"computer_warehouse\"), database, schema, username, and password. \n- Replace placeholder variables in schema retrieval workflows with your actual database and data source names. \n- Verify the credentials by testing the connection; reset passwords if needed.\n\n"
},
"typeVersion": 1
},
{
"id": "a207fdbc-7223-49ed-9798-9d3415634b39",
"name": "付箋12",
"type": "n8n-nodes-base.stickyNote",
"position": [
560,
160
],
"parameters": {
"color": 7,
"width": 330.5152611046425,
"height": 240.6839895136402,
"content": "### ... or watch set up video [5 min]\n[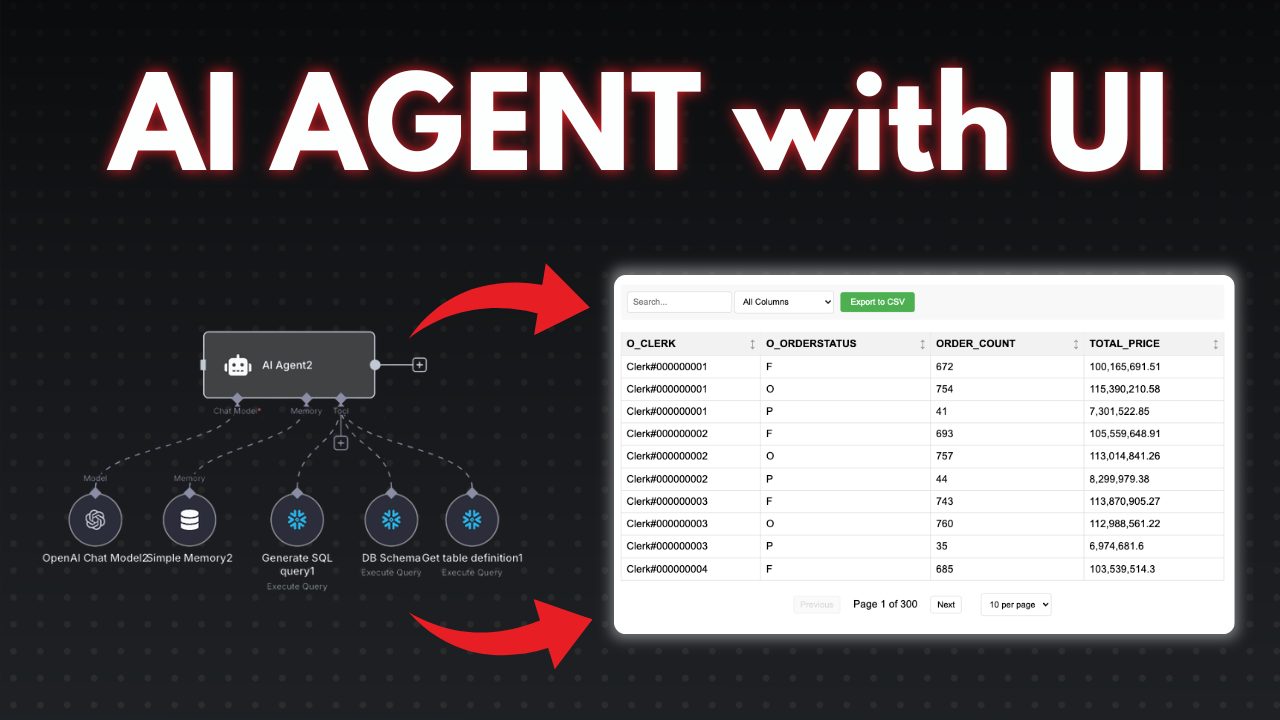](https://youtu.be/r7er-HCRsX4)\n"
},
"typeVersion": 1
}
],
"pinData": {},
"connections": {
"226b3c2e-7058-476e-a96c-d6cf8bd4f53b": {
"main": [
[
{
"node": "caec4943-2a9e-4c93-b9f0-46c05e1c977b",
"type": "main",
"index": 0
}
]
]
},
"f7abd0a8-8aa4-4aa7-ae24-22d40736c67f": {
"main": [
[
{
"node": "e08d0061-a5b9-452d-aae1-dd06c5e76478",
"type": "main",
"index": 0
}
],
[
{
"node": "c67e5a20-e116-4955-bc66-fe8b4384b284",
"type": "main",
"index": 0
}
]
]
},
"6971de5a-a520-4f74-a5c4-87039b22a15f": {
"main": [
[]
]
},
"7bf75ddf-38df-454d-908f-32cbeb785464": {
"main": [
[
{
"node": "f7abd0a8-8aa4-4aa7-ae24-22d40736c67f",
"type": "main",
"index": 0
}
]
]
},
"f809bc79-d5ed-466c-82c2-4c298a079f10": {
"ai_tool": [
[
{
"node": "6971de5a-a520-4f74-a5c4-87039b22a15f",
"type": "ai_tool",
"index": 0
}
]
]
},
"c67e5a20-e116-4955-bc66-fe8b4384b284": {
"main": [
[
{
"node": "e08d0061-a5b9-452d-aae1-dd06c5e76478",
"type": "main",
"index": 0
}
]
]
},
"caec4943-2a9e-4c93-b9f0-46c05e1c977b": {
"main": [
[
{
"node": "7bf75ddf-38df-454d-908f-32cbeb785464",
"type": "main",
"index": 0
}
],
[
{
"node": "c67e5a20-e116-4955-bc66-fe8b4384b284",
"type": "main",
"index": 0
}
]
]
},
"fc341443-ec9c-4005-8b67-dce59e8b4119": {
"main": [
[
{
"node": "935f1932-e803-4daf-89ae-e3ce9f322962",
"type": "main",
"index": 0
}
],
[
{
"node": "4fa89cd3-64d8-40cf-87f1-d604aca9c7eb",
"type": "main",
"index": 0
}
]
]
},
"1c7362be-e338-4976-8a18-a40f11e01ef1": {
"main": [
[
{
"node": "36440a5e-d254-4995-be8e-2e8313b8bc29",
"type": "main",
"index": 0
}
],
[
{
"node": "c581ea63-c210-4df9-b029-f58c1c8da75d",
"type": "main",
"index": 0
}
]
]
},
"3b69b3eb-7a91-43b3-8839-13b5bbdf3203": {
"ai_tool": [
[
{
"node": "6971de5a-a520-4f74-a5c4-87039b22a15f",
"type": "ai_tool",
"index": 0
}
]
]
},
"7f57e580-ac48-4926-8dda-5ae581ca7345": {
"ai_memory": [
[
{
"node": "6971de5a-a520-4f74-a5c4-87039b22a15f",
"type": "ai_memory",
"index": 0
}
]
]
},
"935f1932-e803-4daf-89ae-e3ce9f322962": {
"main": [
[
{
"node": "1c7362be-e338-4976-8a18-a40f11e01ef1",
"type": "main",
"index": 0
}
]
]
},
"f14d403f-a3d1-4535-aaca-767f9258166c": {
"ai_languageModel": [
[
{
"node": "6971de5a-a520-4f74-a5c4-87039b22a15f",
"type": "ai_languageModel",
"index": 0
}
]
]
},
"68907f64-aa11-4044-b2ba-d7796fff90f4": {
"ai_tool": [
[
{
"node": "6971de5a-a520-4f74-a5c4-87039b22a15f",
"type": "ai_tool",
"index": 0
}
]
]
},
"695a7e9f-01c6-4290-a085-55099d8db7db": {
"main": [
[
{
"node": "6971de5a-a520-4f74-a5c4-87039b22a15f",
"type": "main",
"index": 0
}
]
]
},
"eb82d533-e0a0-4328-a31c-39433cf45740": {
"main": [
[
{
"node": "fc341443-ec9c-4005-8b67-dce59e8b4119",
"type": "main",
"index": 0
}
]
]
}
}
}このワークフローの使い方は?
上記のJSON設定コードをコピーし、n8nインスタンスで新しいワークフローを作成して「JSONからインポート」を選択、設定を貼り付けて認証情報を必要に応じて変更してください。
このワークフローはどんな場面に適していますか?
上級 - 内部Wiki, AIチャットボット
有料ですか?
このワークフローは完全無料です。ただし、ワークフローで使用するサードパーティサービス(OpenAI APIなど)は別途料金が発生する場合があります。
関連ワークフロー
Mark Shcherbakov
@lowcodingdevI am a business analyst with a development background, dedicated to helping small businesses and entrepreneurs leverage cloud services for increased efficiency. My expertise lies in automating manual workflows, integrating data from multiple cloud service providers, creating insightful dashboards, and building custom CRM systems. https://www.linkedin.com/in/marklowcoding/
このワークフローを共有